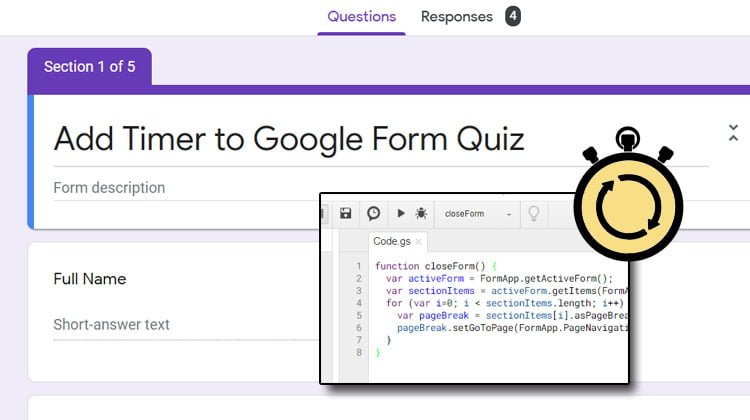
Finally, I found a way to add a timer to a google form, and yes, it forces the user to submit the form after a given time. It's not like all the other plugins that will only close the form to not accept responses and the users that are in the process of filling in the form will lose their answers. Imagine the student who spends an hour answering the question to be only 1 minute … [Read more...] about Add Timer in Google Form Quiz
Create an Issue Tracking System with Google Form and Spreadsheet
Based on the solution in this how-to you will be able to build a Ticketing System, also known as Issue Tracking System, using Google Form, Google Spreadsheet, and Google Script. The solution is very simple to implement and you can easily add some more functionality and use it on the go.Basically, with this Issue tracking system you can:I have also created a Google … [Read more...] about Create an Issue Tracking System with Google Form and Spreadsheet
Google Script Authorization: Review and Accept the Permission Guide
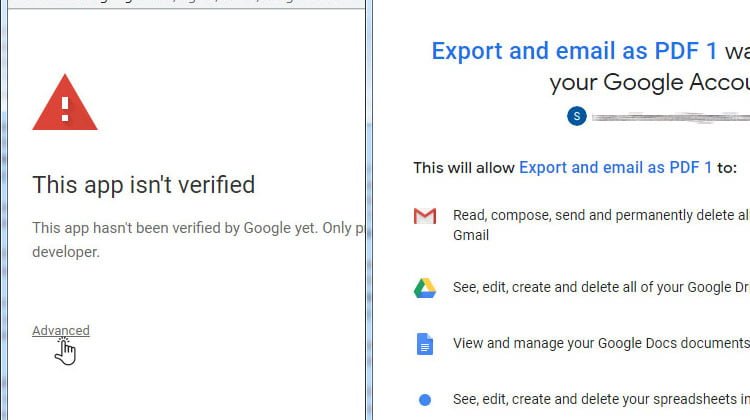
Every time you use a Google apps script class in your script that accesses your account or data, Google will inform you and ask for your consent. Also, every time you add a new class that accesses your data you will have to go through the process again.This process is not straight forward like click here to accept permissions, you will have to deal with a couple of dialogs, … [Read more...] about Google Script Authorization: Review and Accept the Permission Guide
Create an Inventory Management System with Google Form and Spreadsheet
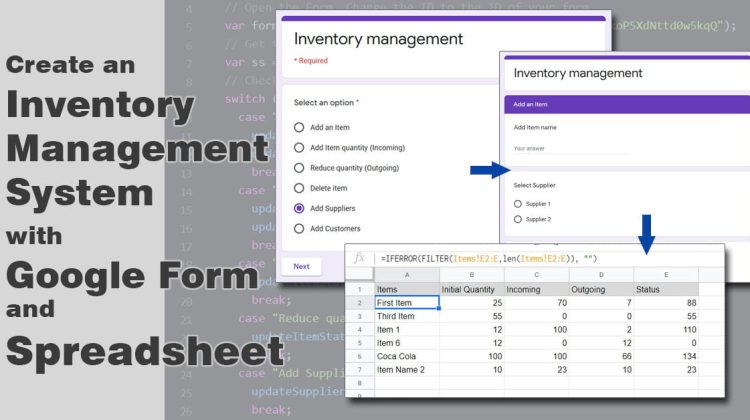
I know you have your Spreadsheet where you track your Stock/Inventory list and probably you have formulas there to do analysis on the data, and some pivot tables and charts. But you have to be on your computer to add or reduce the quantity or check the current status. This solution is very simple and you can use it on your mobile and check the Inventory on the go.With this … [Read more...] about Create an Inventory Management System with Google Form and Spreadsheet
Google Sheets Script for Auto Numbering Google Form Responses
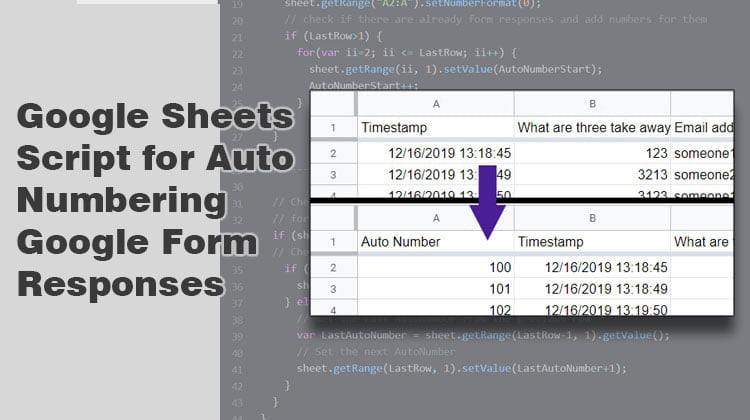
In the previous article, Add Auto Number to Google Form Response Sheet, we used a formula to automatically add numbers to Google Form responses in the sheet. The formula was easy to implement and you can also use text mixed with numbers. But the main problem with using this solution is that it always resets the numbering, so if you delete a response all the following responses … [Read more...] about Google Sheets Script for Auto Numbering Google Form Responses


