There is a lot of small businesses that cannot afford a full-featured app to do their reports. They usually use a spreadsheet to analyze their data. The biggest problem with this is that the process to enter the data on a daily basis is hard and time-consuming, especially for daily sales report sheets. To automate this process and save some time it is best to set up and collect the data directly from a Google Form.
This type of report can be used if there is a small number of products or services that the business offers. It can also be used to collect data from different stores into one general report. Basically it will be difficult to implement if there is a large number of products or services, but not impossible.
So, in this how-to, we are going to create a daily sales report sheet that analyzes data collected through Google Form. First of all, we are going to create a Google Form to collect the data and then select a spreadsheet as a data destination and do the necessary calculation there. Finally, we can set up a Google Site to display the results: Google Site with Daily sales report.
Basically, we are going to create a small web app without even knowing how to program.
Create a Google Form to collect data
If you don’t know how to create a Google Form, follow this guide: How to Create Google Form. You can also check the Google Forms Question Types to learn about the different questions you can put in your Form and this guide to learn how to check for the responses: How to Google Form Responses. For this example, I’m going to use a small Form just to collect only basic data for sales. So, here is the link for the Google Form:
- this link will create a copy of that Form in your Drive: Daily Sales Report Form
- and here is the web front of the form: Daily Sales Report data entry form.
If you want to create your own Form I suggest adding response validation on the Quantity for the product/service. You should validate the response to be a number.
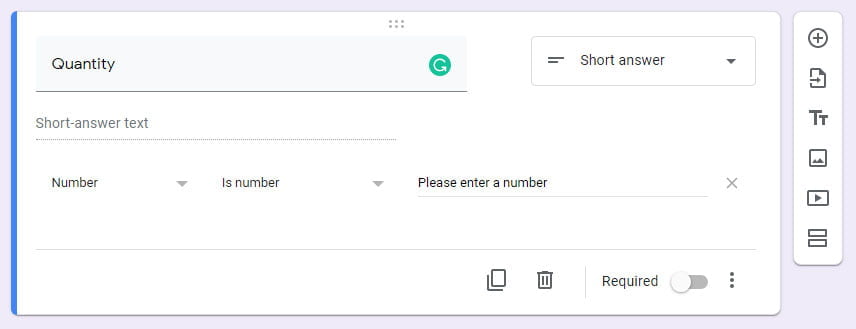
Also, you should avoid adding the price field in the Form to minimize human error. It is better to add the list of products with the prices in your spreadsheet. Here is the multiple choice question that I created in my form to collect the product/service for the sales report.

You can also collect reports from different stores that you have, but instead of using “Quantity” you can ask for the daily profit and expenditures. This type of report cannot handle a large number of products/services because it can get cluttered with a lot of data, but it doesn’t mean it cannot be done.
To enter a product together with the number of sales made today, the responders are going to add one product at a time. To add another product they should click on the “Submit another response”, so you should make sure that this option is enabled in the settings.
Now that you have a form, you should select a spreadsheet to collect the answers. You can do that by accessing the three-dot menu in the responses tab of your form and select “Select response destination”.
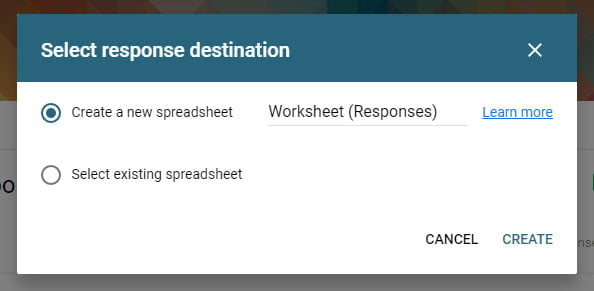
Your form is now ready to start collecting the sales data and we can continue to the spreadsheet to set up the formulas.
Before we continue, check the article here to get familiar with some methods to analyze data from the Form responses sheet: Google Forms Spreadsheet Data Analysis
Creating daily sales report sheet
Open the spreadsheet with the responses to start working on your report. To see all the formulas that we are going to implement get the spreadsheet here: View only sheet (Responses).
First, you should create a new sheet in your spreadsheet where we are going to add our formulas to calculate the daily sales report. I’m going to name mine “Daily sales report”.
At the beginning of the sheet add the function to get the today date, in the given spreadsheet is the cell C1. We will use this value in the formulas to compare the dates and filter the sales for today. In my sheet, there is a fixed date “1/17/2020” in order to get the formulas working with the current data in the “Form responses 1” sheet. Otherwise, I should add values every day :(.
But you should put this function there in order to always get the today date:
=TODAY()
You can insert this function inside the formula that we are going to use to get the sales for that date, but this way it is much simpler. Now, we know the name of the products and their prices, so we are going to start by adding these values in the sheet. Also, we are going to add the field for “Quantity” and “Total Today”, where we are going to add our formula. Here is the first step: 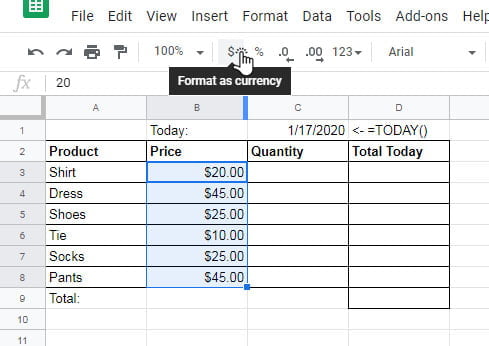
Normally, the values in the Price column are going to be formated as Currency.
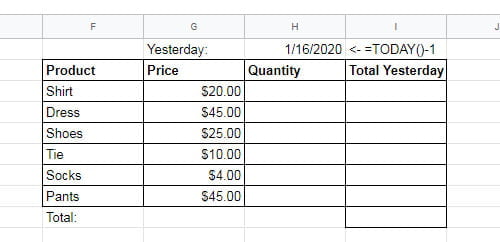
Also, we are going to do a sales report for yesterday, so for the next table you should add the formula to get the date for yesterday, in my case in H1 cell. The formula to get the date for yesterday is:
=TODAY()-1
And here is the table to which we are going to use to calculate the sales report for yesterday:
The next step is to get the quantity for each product from the ‘Form responses 1’ sheet. To do that we are going to use the FILTER function. The FILTER function returns a value or a range that meets specific conditions, you can check the syntax here: https://support.google.com/docs/answer/3093197.
Here is the syntax for the FILTER function:
FILTER(range, condition1, [condition2, …])
The conditions that have to be met in order to get the correct quantity will be the date and the name of the product.
For the range field, we are going to use the column with the numbers for the quantity, in my case: ‘Form responses 1’!C2:C. But because we are going to copy and paste the formula we are going to use an absolute reference of cells, so the range will be: ‘Form responses 1’!$C$2:$C
For the first condition, we are going to compare the date of submission (located in ‘Form responses 1’ column A) with today’s date, located in the C1 cell. The problem here is that the value for the date in the ‘Form responses 1’ column A is not in the desired format, so we need to convert it with DATEVALUE function: https://support.google.com/docs/answer/3093039. And because we are going to copy and paste the formula, again we are going to use absolute references for the cells. The first condition is going to be:
DATEVALUE (‘Form responses 1’!$A$2:$A)=$C$1
For the condition2 we are going to compare the name of the product from the Form responses 1 column B with the name of the product from the table, located in A3 cell. So, the condition2 will be:
‘Form responses 1’!$B$2:$B=A3
You can notice that we don’t use absolute reference for the A3 cell, where the product name is located. This is so it can change to A4 when we copy the formula for the next product.
Finally, here is the whole formula to get the quantity for the first product (cell C3):
=FILTER (‘Form responses 1’!$C$2:$C, DATEVALUE(‘Form responses 1’!$A$2:$A)=$C$1, ‘Form responses 1’!$B$2:$B=A3)
But now, If there is more then one entry for the specific product on the same day you will get 2 or more values and it will overlap with the next value and produce an error. So, to get the correct quantity we need to sum these numbers. For this, we are going to use the SUM function.
Also, if the filter does not return any value it will raise an error instead of displaying a zero value. To fix this we are going to use the IFERROR function to return a zero if there is an error.
And now, the final formula will look like this:
=SUM (IFERROR ( FILTER (‘Form responses 1’!$C$2:$C, DATEVALUE (‘Form responses 1’!$A$2:$A)=$C$1, ‘Form responses 1’!$B$2:$B=A3), 0 ) )
Now, that we have the correct formula in the quantity field we can copy it by dragging it for the rest of the products. You can also use copy/paste.
Do the same for the sales report for yesterday, but change, in my case, $C$1 to $H$1 and A3 to F3, and then copy the formula by dragging.

Finally, we can calculate the product of the Price (B3) and Quantity (C3) in the Total Today field (D3) using the formula “=B3*C3”. Next, copy this formula for the rest of the products. In the Total field (D9) add formula to calculate the sum of all totals: “=SUM(D3:D8)”. Do the same for the report for yesterday. This is the result:

This is it, we have the report for today and yesterday sales. We can also include more days, just add the corresponding date in the formula. Also, we can improve the formula and check if the day is Saturday or Sunday and skip them.
Create Charts for Daily Sales Reports
The next step to prepare your reports to be displayed on Google Sites is to create charts. Generally, you can insert the whole spreadsheet into the page on Google Site, but it is going to be more readable if you insert only the data concerning the report. To do that you need to create a “Table chart” from today and yesterday’s sales report.
It is very simple to create “Table Chart”, just select the table with the sales report and select to insert “Chart” from the Insert menu or yo can click on the “Insert chart” icon from the toolbar.
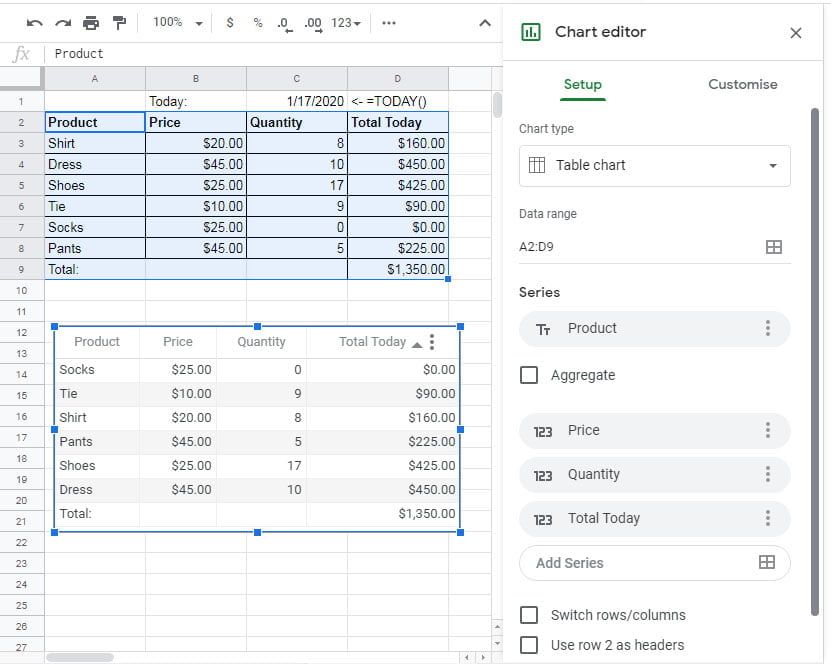
Do the same for the table with yesterday’s sales report and you will have two Table charts that you can insert in your Google Site and display the data there.
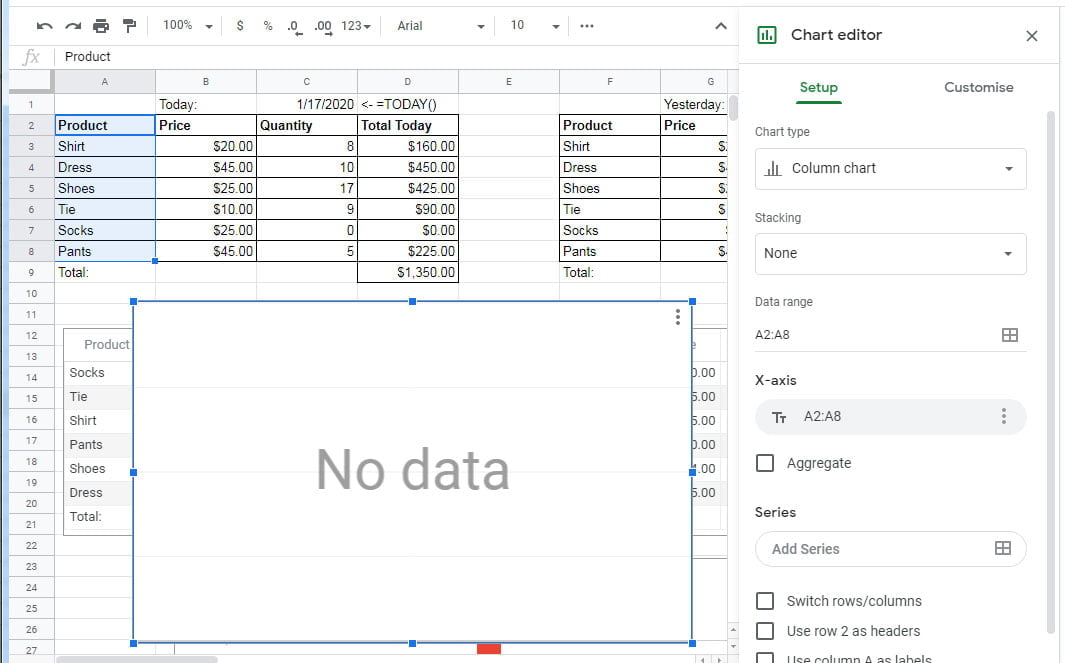
You can also create a Barchart where you can compare the sales from the two days. To do that, first, select the product names the range A2:A8, and then select Insert Chart. Google sheets will create a chart with no data in it, something like this:
Then, in the Series part in the Chart Editor, add the series for “Total today” range: D2:D8 and “Total Yesterday” range: I2:I8. After this, Google Sheet will create a Bar chart with your data and you can use this chart to put it on your Google Site.
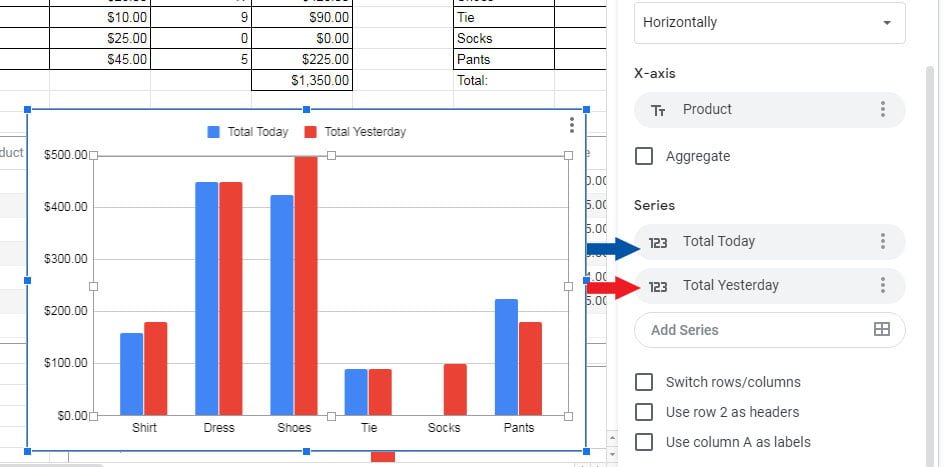
Now, you can also insert this chart in your Google Site. You can find the guide to create, publish and share these charts on your Google Site here: Create a Google Site and Insert Charts from Spreadsheet
Also, I have created a sheet “Weekly sales report” with a sales report for current and last week, you can check that too. Here is the link to the sheet in case you missed it: Daily Sales Report Sheet.
