
There are a couple of ways you can view and analyze Google Form responses. The default one includes the answers from the Google Form in the Form itself, on the responses tab.
Follow this guide if you want to learn How to Create Google Form
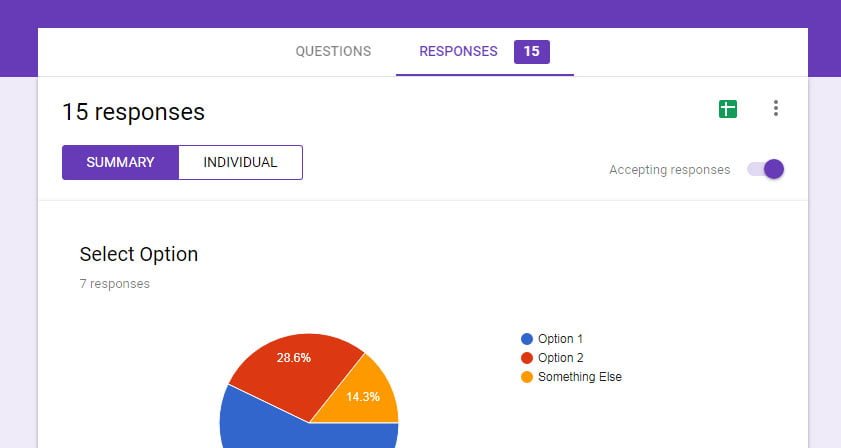
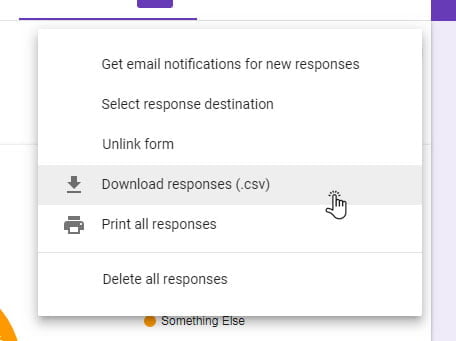
Also, on the Google form responses tab, you have information about the number of responses gathered. You can find this information on the name of the tab and in the title, in this example, I have 15 responses on this form. In this tab, you can also access other options, like create and link a spreadsheet to the form. Here is a list of options available on the form responses tab from the three-dot menu on the top-right:
- Get email notifications for new responses
- Select responses destination – here you can create or select an existing spreadsheet to collect the answers
- Unlink form – this option is available if you already linked a spreadsheet to collect the answers
- Download responses (.cvs) – get the responses in the form of .csv file on your computer
- Print all responses – this will print all the individual responses, like in the “INDIVIDUAL” preview of responses
- Delete all responses – this will delete all responses collected in the form, but it will leave the responses in the linked spreadsheet intact.
Google Form Responses Tab
On the responses tab, you can view the results in “SUMMARY” or in “INDIVIDUAL” mode.
Generally, responses are going to be shown in summary mode, which means that you are going to have a summary of each question. They are going to be shown in a form that is adequate for the question.
Multiple choice question summary
For example, if the question is a multiple choice type, the summary of responses is going to be shown in a pie chart. You will get a percentage of a chosen option, and if you have “Other” in the multiple choice question, it will display the option specified by the user, in this case “Something Else”.
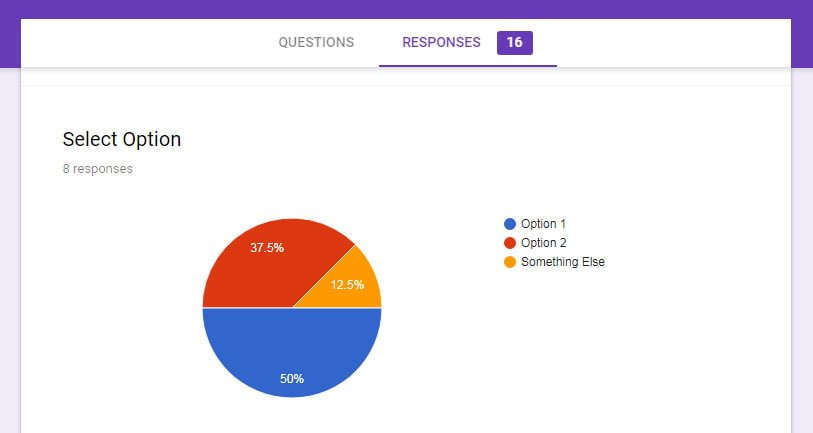
Also, under the name of the question you have a number of responses for that question. You can see that there are a total of 16 answers on the form and only 8 answers on that question.
Linear scale, Multiple choice grid, and Checkbox grid question summaries
Similar to the multiple choice, a summary of responses for the Linear scale, Multiple choice grid, and Checkbox grid question types are going to be shown in the bar chart.
Here is how the summary of responses for the Linear scale looks:
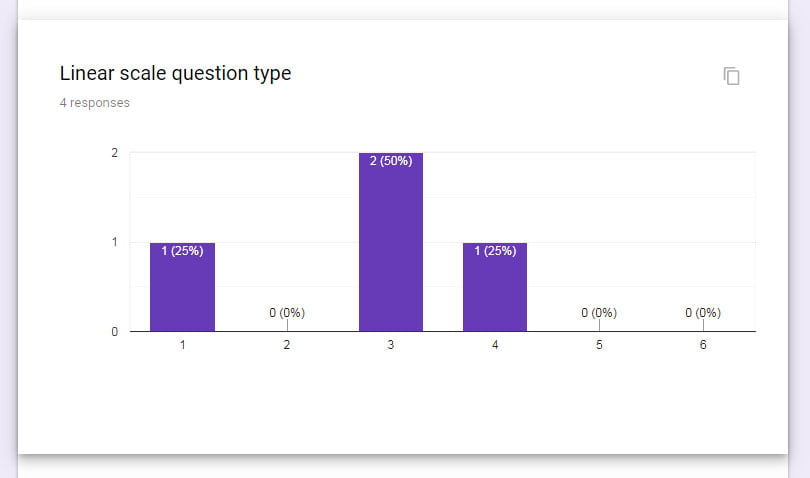
From this summary, we can see that 4 people have answered this question and most of them, 50 percent, have chosen number 3 on the linear scale from 1 to 6. One or 25% percent have chosen number 1 and one or 25% have chosen number 4.
For the Multiple choice grid and Checkbox grid question types, again you have a bar chart but this time with 3 values. You have colors to represent the third value. Here how the summary for Multiple choice grid questions is going to look:
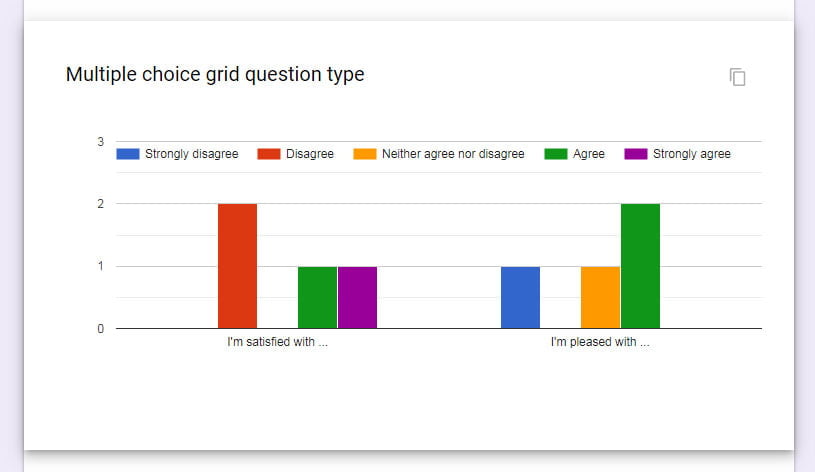
Google forms add the rows as values on the x-axis and the columns are represented with colors. Values on the Y-axis are the number of selected answers that each column gets from users. From this bar chart, we can see that with the first question “I’m satisfied with…” we have 2 people that “Disagree”, one “Agree” and one “Strongly agree”.
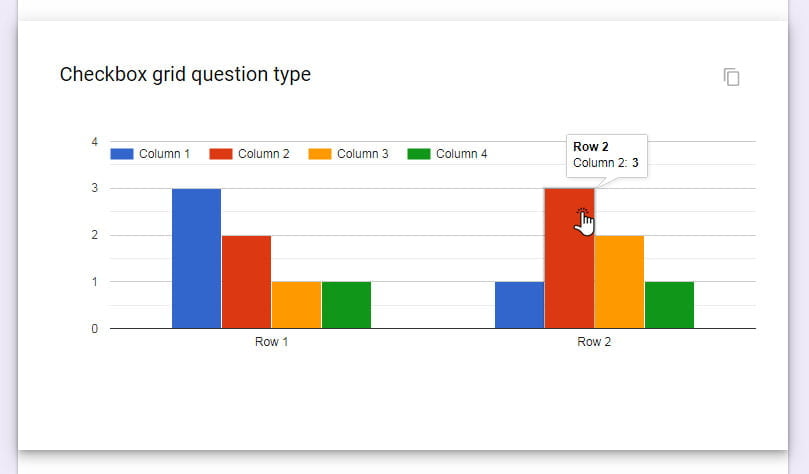
Here how the summary for Checkbox grid questions is going to look:
Short answer and paragraph summary
For this type of questions you will get a summary of responses in the form of a list. You can check how this looks in the next image:
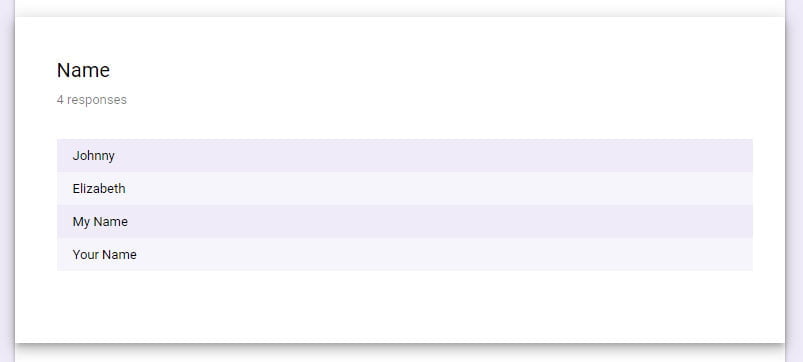
As you can see from this summary, the question title is “Name” and I have 4 responses on that question. This is a short question type, but it will display the same summary if I have a Paragraph question type.
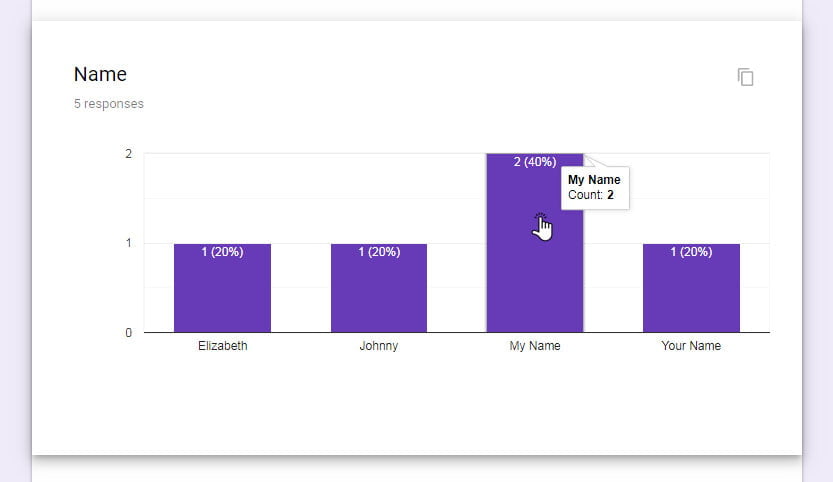
Now, if I have repeating answers on the question, then Google Forms is going to group the same answers and display the results as a bar-chart graph, similar to the multiple choice question. In the next image, you can see how the same question in the responses tab looks like after it gets a repeating answer.
File upload summary
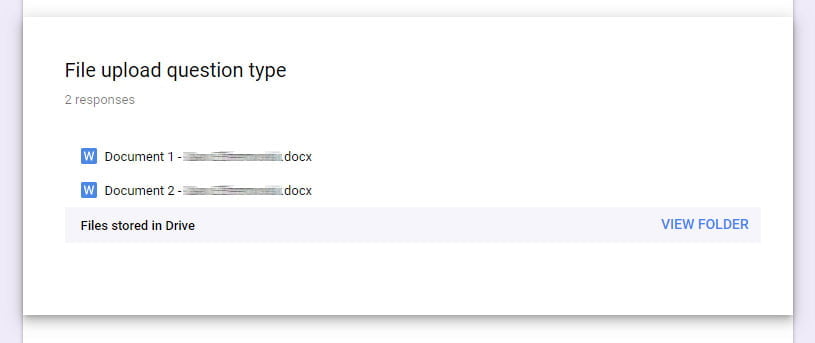
Similar to the short answer and paragraph question type, summary for this question type is going to be a list of uploaded files. As an addition to the name of the file, Google Forms is going to add the name of the sender, as specified in their Google Account. Also, it is going to add a direct link to a folder “VIEW FOLDER” in your Google Drive that stores all the files. Here is how ti looks:
Date and time question summary
The summary for the Date questions is going to look like a list of dates, or if it collects time, as a list of dates with time values. The similar answers are going to be grouped by date, and then by time. So more time values for same date are going to be shown in-line, and if the time values repeat, you are going to get a note for the number of same values. You will see how this looks in the next image:

From this summary, you will notice that I have two same entries for the date: “27 Nov 2019” and time: “11:11”
The summary for the Time question type is going to look the same as for the Date questions, but it will group the answers by the hour. So, if we have multiple entries for 11 o’clock it will group the answers on that hour. You can check the next image for the time question summary:

As you can see, I have multiple answers for 12 o’clock, and two of them are for 12:12 h.
Google form responses to spreadsheet
If you need more analysis on the collected data you can collect all the answers from the Google form responses to spreadsheet.
Create spreadsheet to collect data
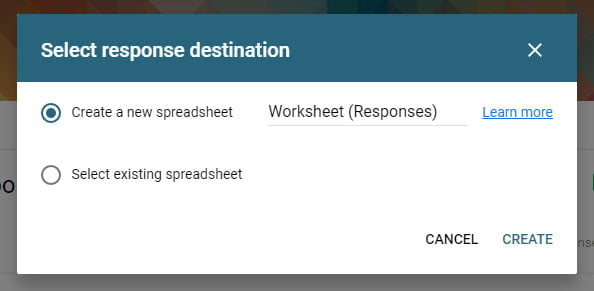
You can select to use an existing spreadsheet, or you can create one directly from your Form. To do this, from the responses tab on your Form select the spreadsheet icon or from the three-dot menu select the “Select response destination” option. In the next dialog, it will give you the option to create new or select an existing spreadsheet to collect the answers.
Tip: First, create the Form, add all the questions and then create the spreadsheet. This way the order of the questions on the Form is going to match the order of columns in the spreadsheet. If you add a question in the middle of the form, after you have created the spreadsheet, it is going to show up at the next empty column in your spreadsheet.
After you have created the spreadsheet, to access it and view all the answers you can just click on the spreadsheet icon from the responses tab.
Also, you can access the spreadsheet from your Drive. The location of the spreadsheet in Google Drive is going to be in the same location where you created the Form.
Spreadsheet layout
The layout of the spreadsheet is going to be very simple. The questions from the Google Form are going to be the titles on the columns and each row will represent one answer. The first column is always going to be the timestamp of the submitted form, and if you set your Form to collect e-mail addresses automatically, the second column is going to be “Email address”. Check the image below:
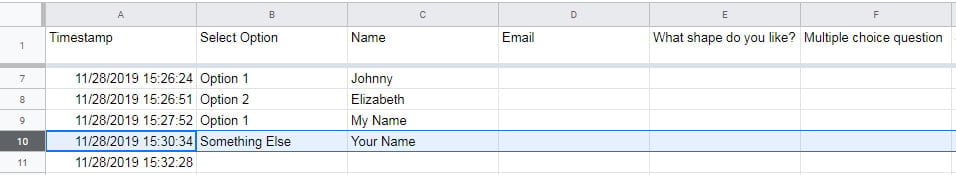
As you can see from this image, in the first row are the titles of the columns and they are the same as the questions in the google form and the next rows are going to have the answers submitted from the Google Form.
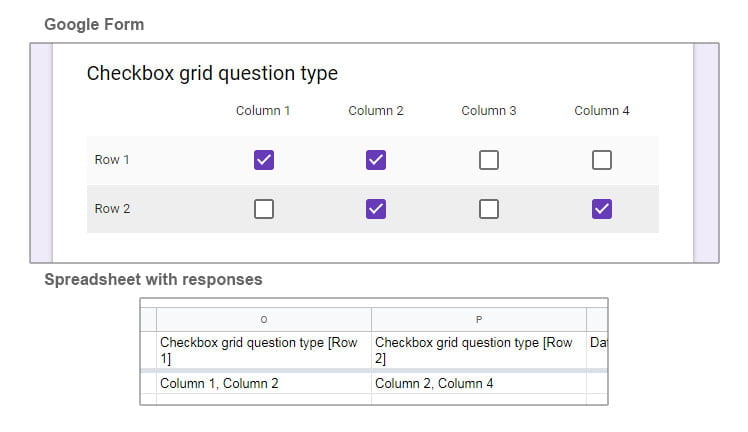
The only difference in the layout of the spreadsheet is going to have the Multiple choice and the checkbox grid questions. They are going to have a separate column for each row on the Google Form, as shown in the image below.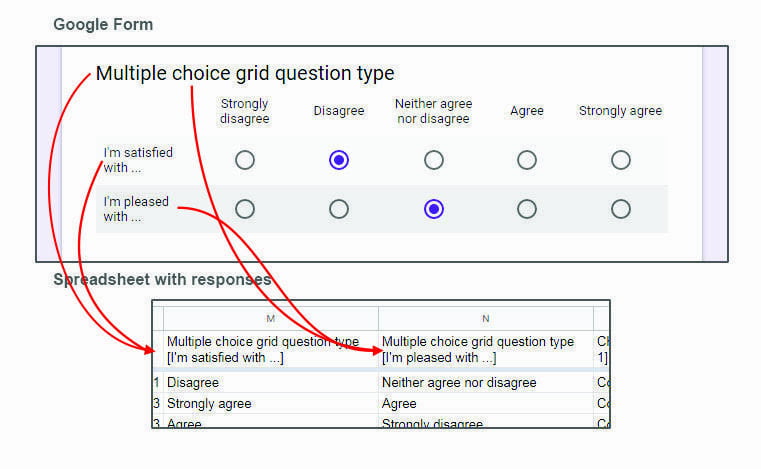
For the checkbox grid type, which has the option to select multiple responses for each row, you are going to get the responses in one cell separated by a comma. You can see how this looks like in the next image:
Whit having all the responses in spreadsheet, you will have an option to do more analyses on the data than what Google Forms offers.
Next
Check this article on how to Google Forms settings.
If you have any questions, just live a comment and I’ll get back to you as soon as possible.