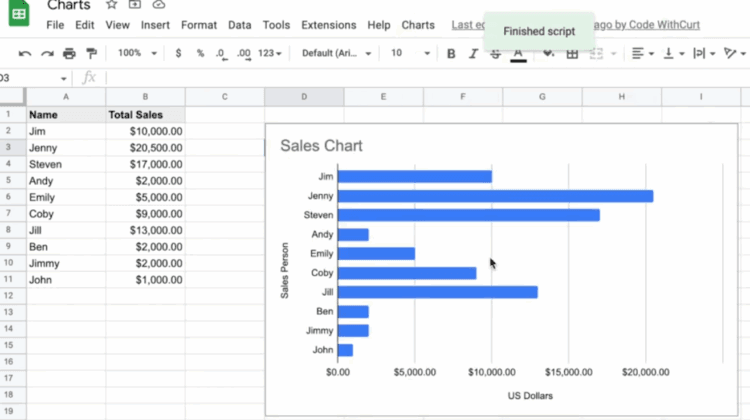
Google Sheets does make it simple to create data visualization, but manually doing that each time is not desirable. Using a little Google Apps Script, you can automatically generate and insert a chart from your data. This is particularly useful if you are updating a table of data on a regular basis and would like a chart to be displayed in a certain location, with formatting … [Read more...] about Google Sheets: Auto-Insert Charts with Apps Script

How to GApps
Your life changer for G Apps