
Google Forms is a powerful tool for collecting information, whether you’re running surveys, quizzes, event registrations, or feedback forms. But once people start submitting responses, where do they go? And how can you make the most of them?
In this guide, we’ll walk through how to view, organize, export, and even automate your Google Form responses—so you can save time and work smarter.
*Follow this guide if you want to learn How to Create Google Form
1. Where to Find Google Form Responses
Your Google Form automatically saves all responses, and you can access them in two main ways:
Method 1: View Responses Directly in Google Forms
Open your Google Form.
Click the “Responses” tab at the top of the page.
Here, you’ll see two sections:
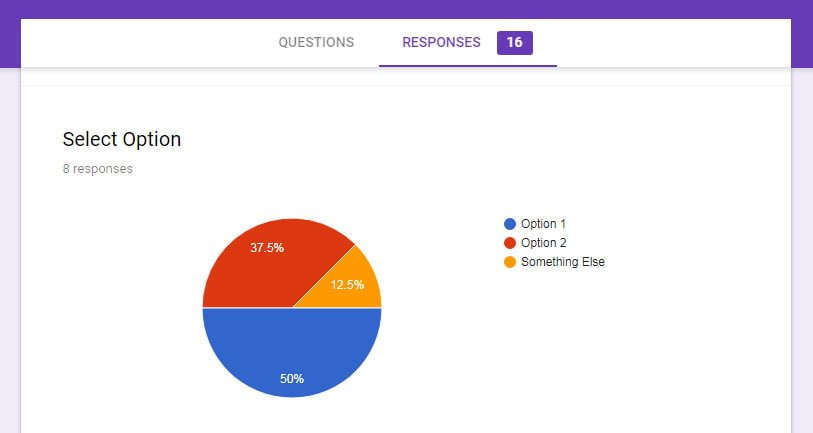
“Summary”: Shows visual charts (like pie graphs and bar charts) for quick insights.
“Individual”: Lets you scroll through each submission one by one.
Pro Tip: The summary view is great for spotting trends, while the individual view helps you dig into specific answers.
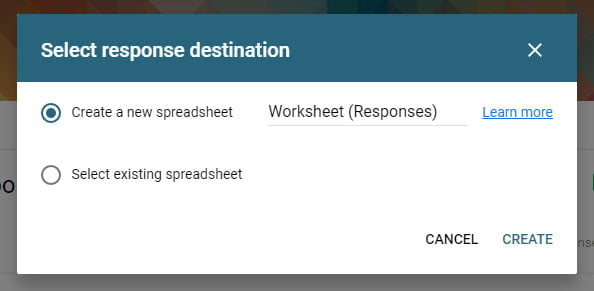
Method 2: View Responses in Google Sheets
If you set up your form to save responses in Google Sheets, you can access them in a spreadsheet format, which is perfect for sorting, filtering, and deeper analysis.
Here’s how:
In the “Responses” tab of your Google Form, click the green Google Sheets icon.
This will open a spreadsheet where every submission is recorded in rows, with questions as columns.
Why this is useful:
You can sort, filter, and use formulas (like
=COUNTIFto tally responses).It’s easier to share with others without giving them access to the form itself.
2. How to Export Google Form Responses
Sometimes, you need a downloadable copy of your responses—maybe for a report, backup, or offline access. Here’s how to do it:
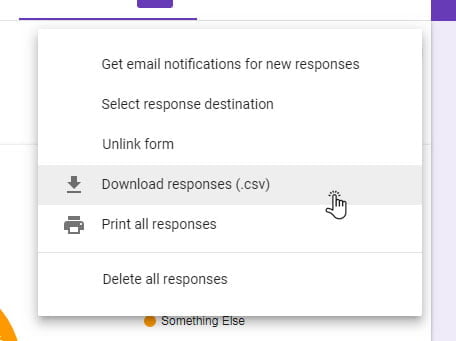
Option 1: Download as a CSV File
In the “Responses” tab, click the three-dot menu (⋮).
Select “Download responses (.csv)”.
This will save a spreadsheet file to your computer.
Option 2: Export as a PDF (From Google Sheets)
If your responses are in a Google Sheet:
Open the linked Sheet.
Go to File → Download → PDF (.pdf).
Choose your layout settings and download.
3. Google Form Responses Tab: How Questions Are Displayed
When you check your form responses under the “Responses” tab, Google Forms organizes the data based on the type of question you asked. Here’s how each question format appears:
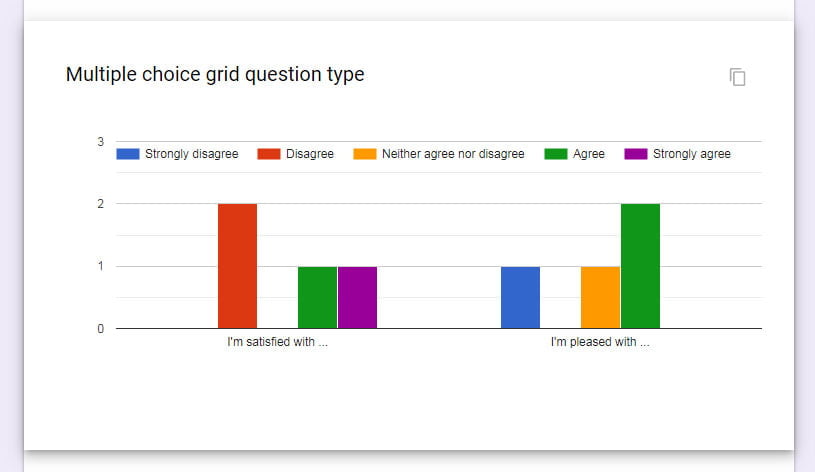
Multiple Choice & Dropdown Questions
In the “Summary” view, you’ll see a pie chart or bar graph showing the distribution of answers.
In the “Individual” view, each submission displays the selected option.
Why this matters: Quickly spot trends—like which option was most popular.
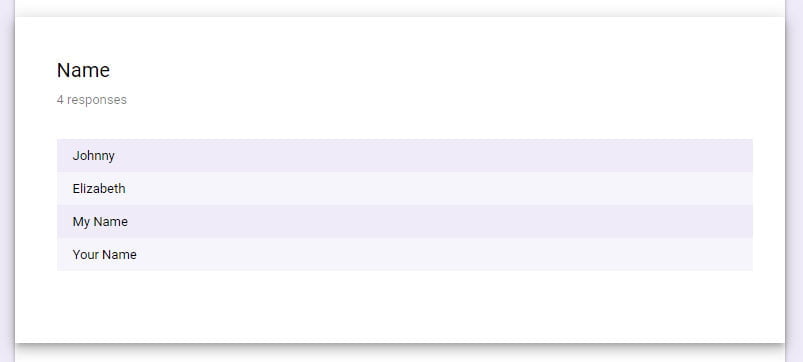
Short Answer & Paragraph (Text Responses)
No charts (since answers are open-ended).
In the “Individual” view, you’ll see the exact text respondents typed.
Tip: Use Google Sheets to sort/filter these responses if you need to analyze keywords.
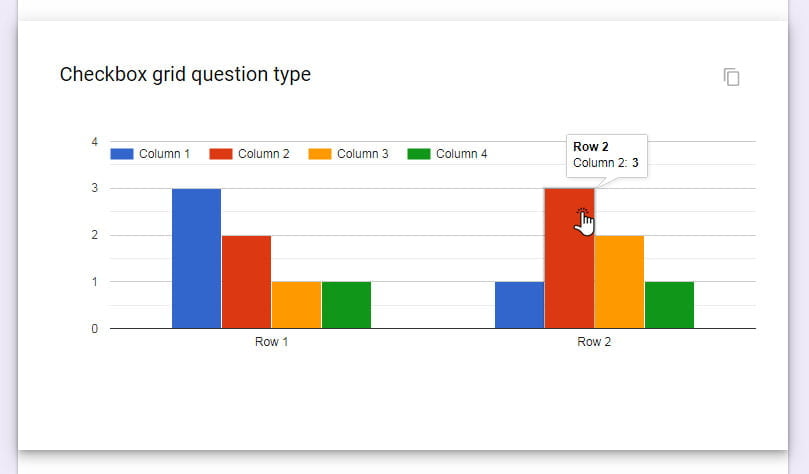
Checkbox (Multiple Answers Allowed)
The “Summary” shows a bar chart with how many people selected each option.
In “Individual”, submissions list all checked boxes in one cell (separated by commas).
Watch out: If analyzing in Sheets, use “Split text to columns” (under Data → Split text) to separate answers.
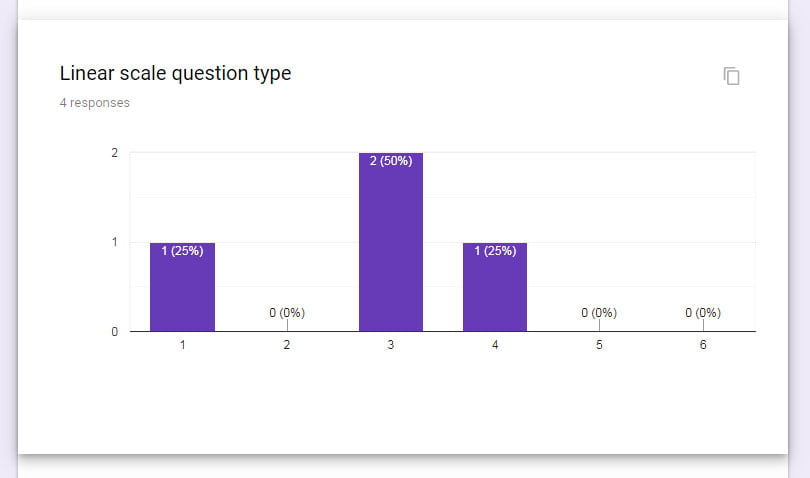
Linear Scale (1–5 Ratings, etc.)
The “Summary” displays a histogram (bar chart) of ratings.
Individual responses show the exact number selected (e.g., “4/5”).
Pro move: Calculate averages in Sheets with =AVERAGE.
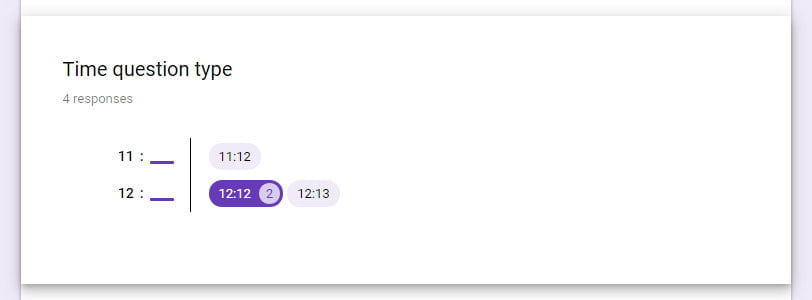
Date & Time Questions
Summary view: No chart, just a list of dates/times.
Individual view: Shows the exact date or time submitted (formatted as YYYY-MM-DD or HH:MM).
Need to sort chronologically? Do it in Google Sheets for better control.

File Upload Questions
No previews in the Form’s “Responses” tab.
Instead, you’ll see a link to the file (stored in your Google Drive).
Critical: Check your Google Drive storage—uploads count against your quota!
4. How to Share Google Form Responses
Need to collaborate with others? Here’s how to share responses without giving full edit access to your form:
Share the Linked Google Sheet
Open the Google Sheet with your responses.
Click the “Share” button in the top-right corner.
Enter email addresses and set permissions (e.g., “Viewer” or “Commenter”).
Embed Charts in Docs or Slides
Want to include response graphs in a presentation?
In Google Sheets, click on a chart.
Click ⋮ → Copy chart.
Paste it into Google Docs or Slides.
5. Bonus: Automate Your Google Form Responses (New Section!)
Want to save even more time? Try these automation tricks:
Get Email Notifications for New Responses
Use Google Apps Script to send you an email every time someone submits the form.
Auto-Save Responses to a Folder
Set up a Google Drive rule to organize responses by month or category.
Connect to Other Apps (Zapier/AppSheet)
Automatically send form data to Slack, Trello, or Airtable for follow-ups.
Final Tips for Managing Responses
Pause responses: Under Responses → ⋮, toggle “Accepting responses” on/off.
Delete test entries: Click the ❌ next to unwanted submissions.
Use filters in Sheets: Quickly find specific answers (e.g., all “Yes” responses).
Check this article on how to Google Forms settings.