This guide is a part of the how-to: Create daily sales report sheets from Google Form, but it can be considered as a guide to create a Google Site and insert Charts from spreadsheet. You can use the same procedure for inserting or any other Google elements like Google Sheets, Drive folder, Docs, Calendar and etc.
All the charts that we are going to insert in the Google Site can be found in this Google Sheet: Daily Sales Report Sheet. So, the next steps will include creating the Google Site and placing the charts there. The main point for having this setup is to present the data clearly and to always have it up to date.
More about Google sites and difference between the new and the classic sites can be found on this link: Google Sites Introduction and Basic Options
Create a Google Site
The first step is creating a new Google Site. To do that, go to Google Sites app by following this link: https://sites.google.com/new and click on the “Plus” icon located on the bottom right corner of the browser window.
![]()
Google Sites will create a new site with a default template. What you will see in your browser window is the home page with tools to help you add content to it. Here is how it looks:
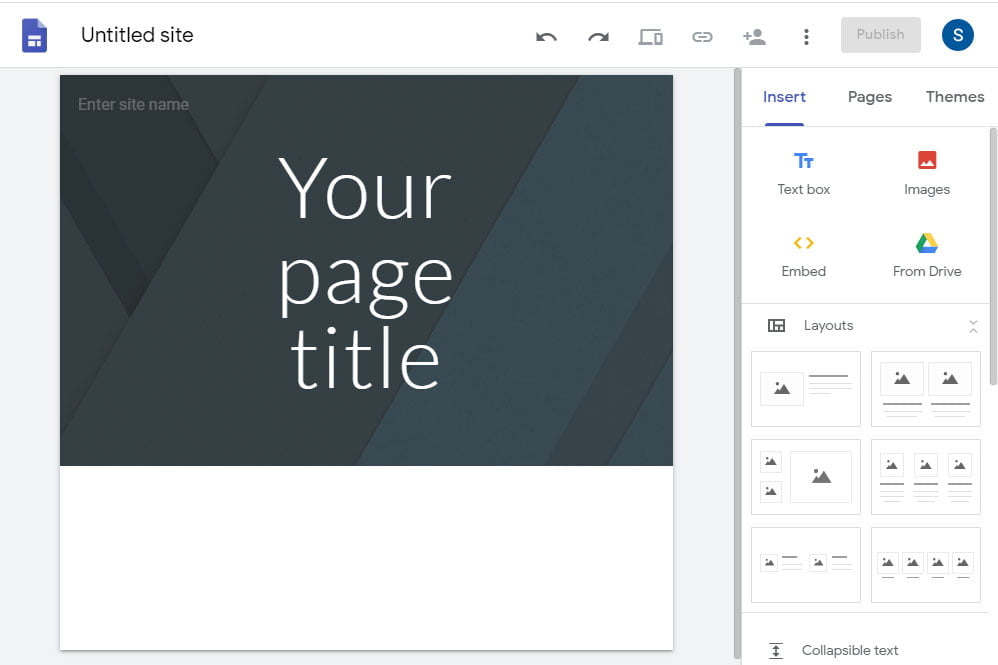
What you want to do first is add a name for your site, something like “Sales Report”. To do that just click on the name of the site, in this case, “Untitled site” and type in the new one. Using the same procedure change the title of your page from “Your page title” to “Daily Sales Report”.
What you see now is the header of your web page with the title. Next, we should add content to the page by using the Insert panel on the right side. What I’m going to do is add a text, using the text box, and add a title and/or description for the charts. And after that add the charts.
Insert Text in Google Site
So, to add a text field in your site use the “Text Box” button from the insert menu. This will add a text box at the end of your page or after the field that you are actively working on.
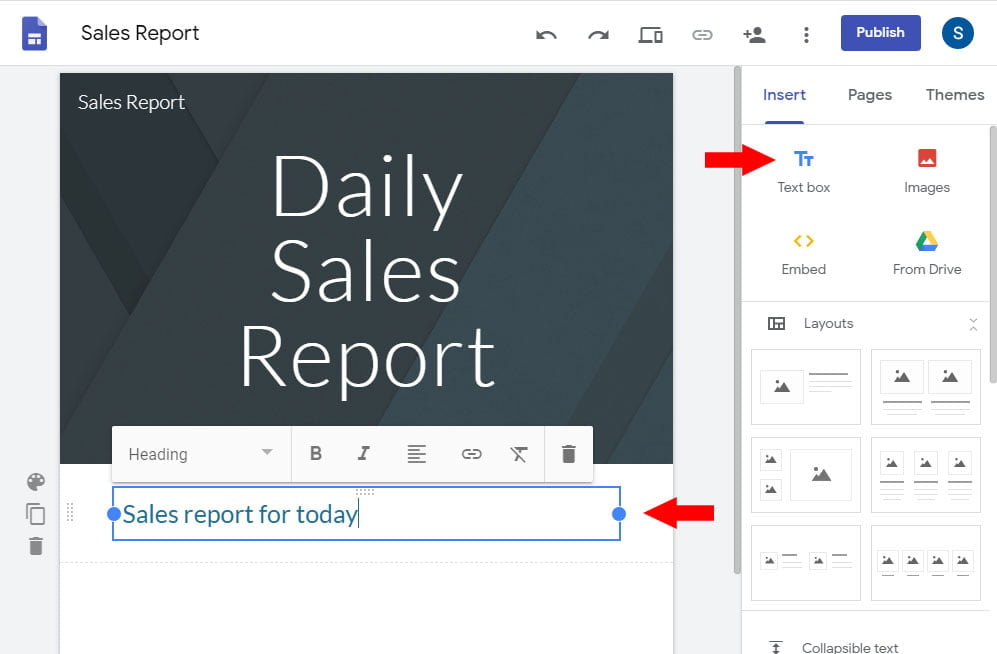
The text box will stretch to the full width of the page, but you can manipulate its size by dragging the dots on the side of the box. On the top of the box you can find tools for text formating. What I did was only to change the paragraph style to Heading and add text “Sales report today”. This is what I use to insert the title for the chart for today’s sales report.
Insert a chart in Google Site
Next, we are going to insert the chart for today’s sales from the Google sheet: Daily sales report Sheet. You will find the shortcut to insert a chart at the bottom of the Insert panel, just scroll down.
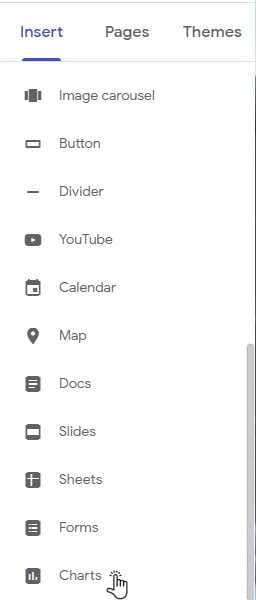
Now, select the Sheet where your chart is located and click on the INSERT, at the bottom of the panel. In my case is the Daily sales report sheet.
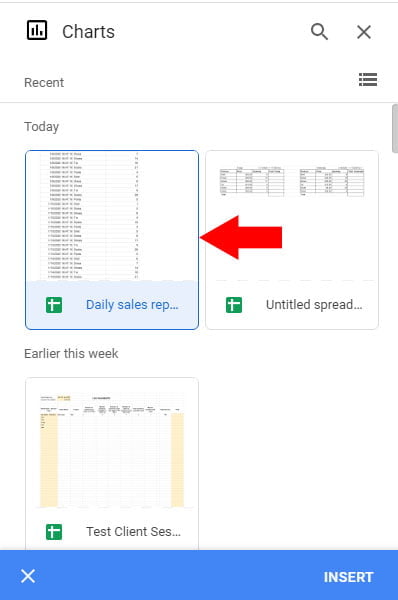
Next, a new dialog will appear with the list of the charts that are available on that sheet. Select your chart and click on “Add”.
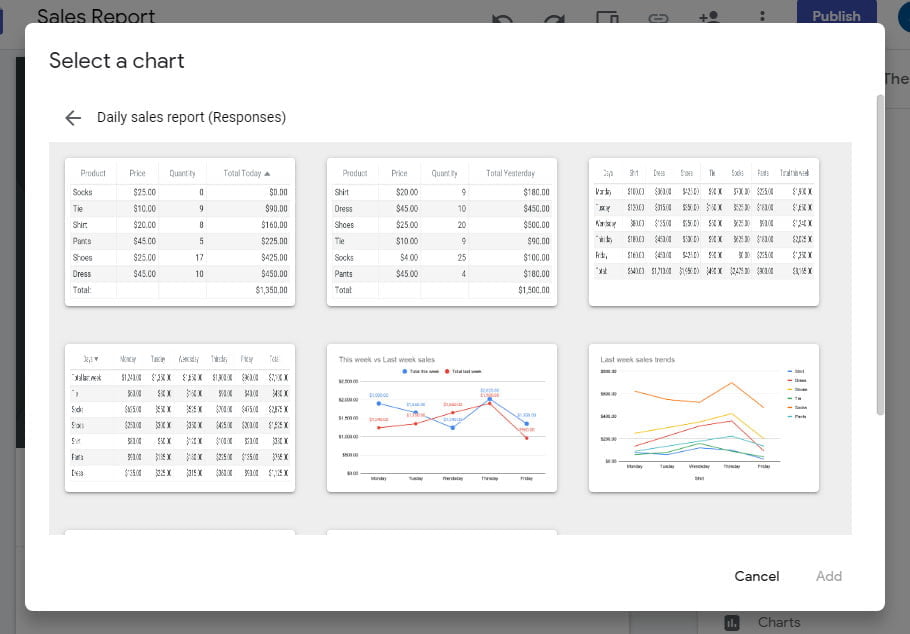
Now that you have inserted your chart, you can manipulate the size of the container to your needs. This is how it looks.
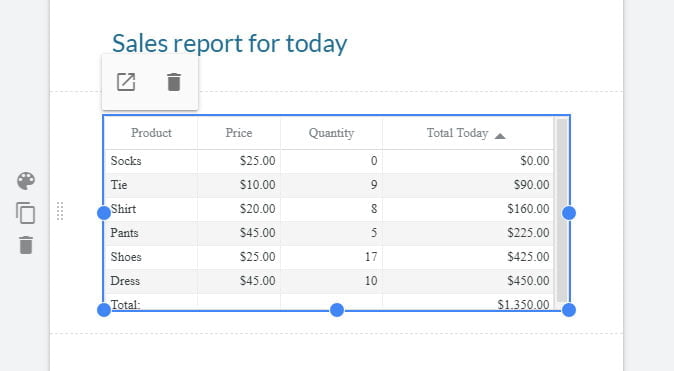
You need to experiment a little bit with the size, because the size of the chart will depend on the size of the page, so you better check how it will look on a mobile phone.
This editor on the Google Sites is WYSIWYG (What YOu See Is What You Get) editor, but you better use the preview option so you can check how your site is going to look on mobile, tablet and on a regular PC browser.

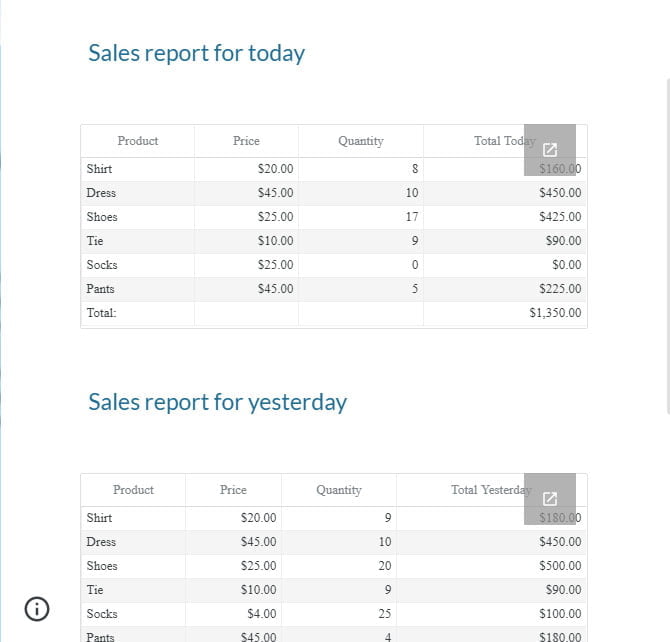
Next, repeat the procedure for every chart you have for the Daily Sales Report. Add a text box with the title for the chart and then add the chart. Here is how my page with the daily sales report looks like:
Add New Page in Google Sites
We are going to create a new page to insert the weekly sales report charts. You can find the charts in the same Spreadsheet in the “Weekly Sales Report” sheet
To insert a new page you have to open the “Pages” side panel and click on the “New Page” button on the bottom of the panel.
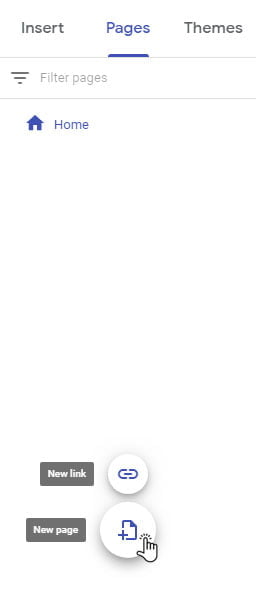
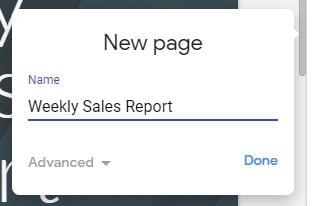
After that Google Sites is going to ask you to add a name for the new page. Add the “Weekly Sales Report” as the name and click on “Done”.
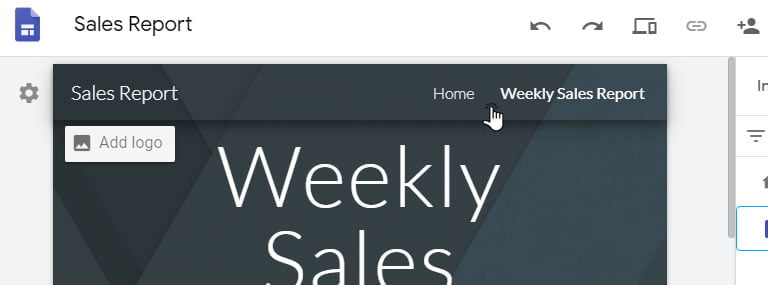
You don’t have to worry about adding links for the site navigation. Google Sites will do that automatically, so people can easily find the “Weekly Sales Report” page or return to the “Home’ page. You can see that on the next image:
Next, you can follow the same procedure and add the titles/descriptions and charts for the weekly sales report.
Publish the Google Site
In order for your site to be accessible by others, you have to publish the site and share the link. To publish the site click on the “Publish” button. A “Publish to the web” dialog is going to appear where you can add the link to your web site.
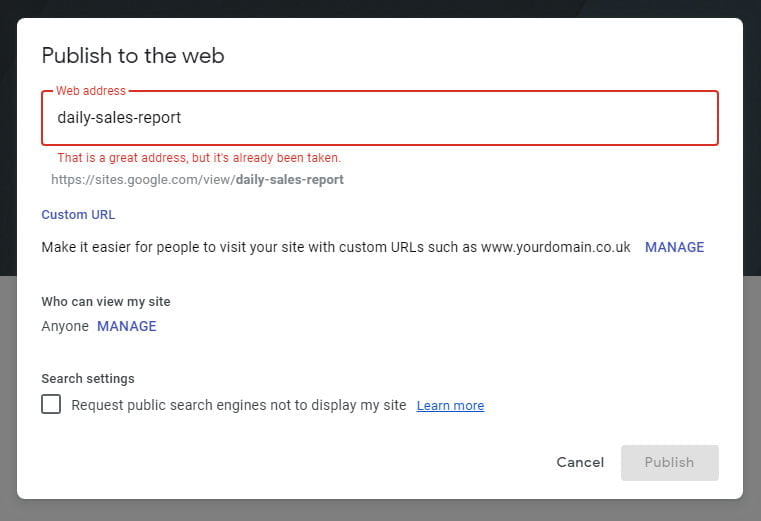
The link is going to be a part of the Google Sites URL, and it will always start with “https://sites.google.com/view/”. Google will automatically check if that address is available if not a short info will appear telling you that the URL is not available.
Here you can also add a Custom URL or you can set up who can view the site. Using this option you can limit the access to the site to only authorized personal. For example, you can set that only specific people can access the site and add the account of your sales manager so he can access it. This way even if it is published, only specific people can access it. Here you can also add people to edit the site.
Conclusion
Here is the link for the Google site from this example: https://sites.google.com/view/daily-sales-report-charts/
If you missed it, here is the link to the Google Form that collects the data for this report: Daily Sales Report data entry form. And here is the link to the sheet that collects the data from the Google Forms and where all the formulas and charts are located: Daily Sales Report Sheet.
If you have any questions just post a comment I’ll get back to you.
