
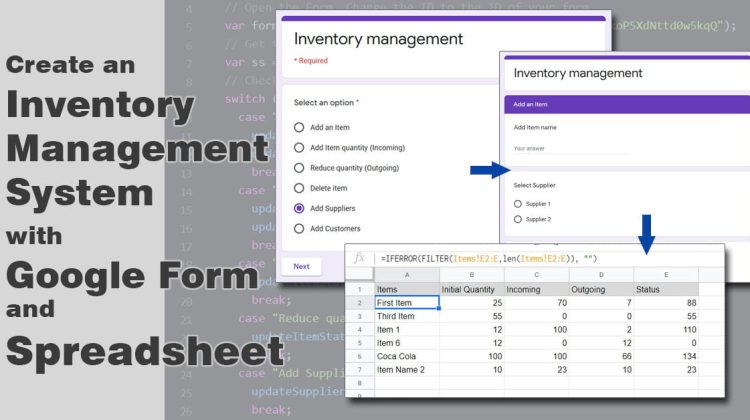
I know you have your Spreadsheet where you track your Stock/Inventory list and probably you have formulas there to do analysis on the data, and some pivot tables and charts. But you have to be on your computer to add or reduce the quantity or check the current status. This solution is very simple and you can use it on your mobile and check the Inventory on the go.With this … [Read more...] about Create an Inventory Management System with Google Form and Spreadsheet
Sheets
Google Sheets Script for Auto Numbering Google Form Responses
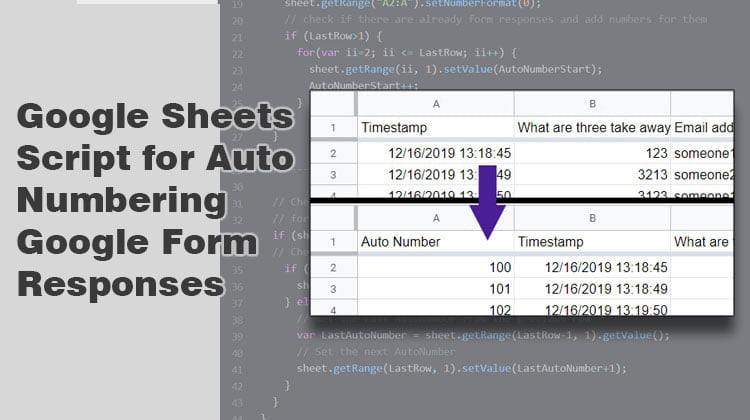
In the previous article, Add Auto Number to Google Form Response Sheet, we used a formula to automatically add numbers to Google Form responses in the sheet. The formula was easy to implement and you can also use text mixed with numbers. But the main problem with using this solution is that it always resets the numbering, so if you delete a response all the following responses … [Read more...] about Google Sheets Script for Auto Numbering Google Form Responses
Create a Script to Send Emails from Google Sheet
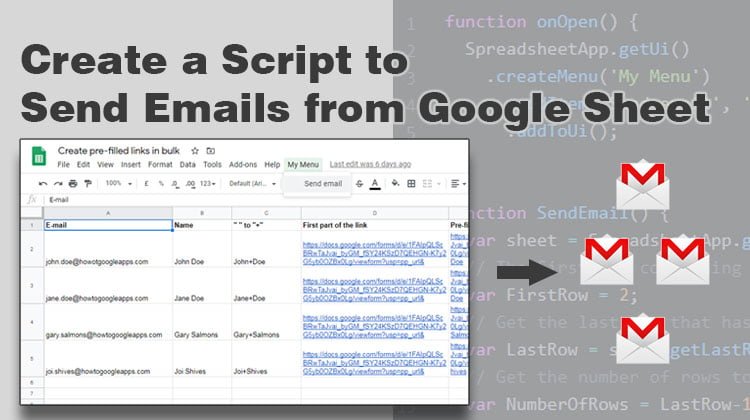
Sending the same email but with some personalized content to a group of people can be a boring and time-consuming process. The best solution to this is to have all the data in the sheet and use a process called MailMerge. But this option is not available in google sheets. So, in this how-to, we will create a script to send emails from google sheet using the data from the … [Read more...] about Create a Script to Send Emails from Google Sheet
Google Spreadsheet Script to create and email a PDF on Form Submission

In this how-to, we will use a script to create and email a PDF on Form submission automatically. So, this script is going to be triggered by submitting the Google Form and it will convert the sheet in PDF. In the next steps, the script is going to save the PDF in your Drive and send it as an attachment in an email.Check this article if you want to AutoFill and Email a Doc … [Read more...] about Google Spreadsheet Script to create and email a PDF on Form Submission
Add Auto Number to Google Form Response Sheet
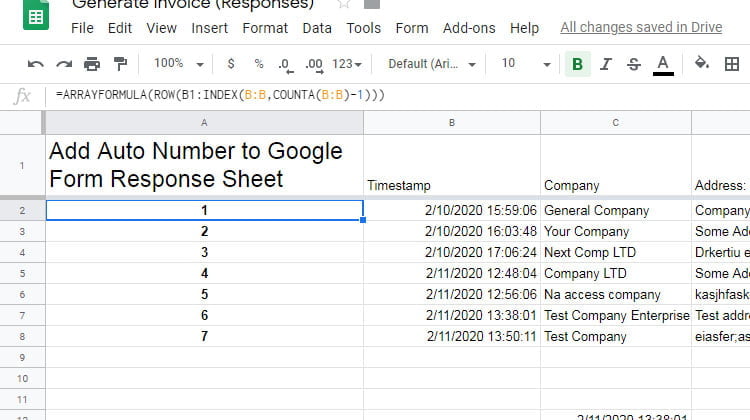
To easily and uniquely identify each Google Form response is to have a key field. That field should be in the form of a number that will be autogenerated to avoid duplicates. This option is not available in Google Forms, so you have to adapt the Form response sheet to do it for you.The auto-number formulaThe formula that we are going to use to add auto number to Google … [Read more...] about Add Auto Number to Google Form Response Sheet