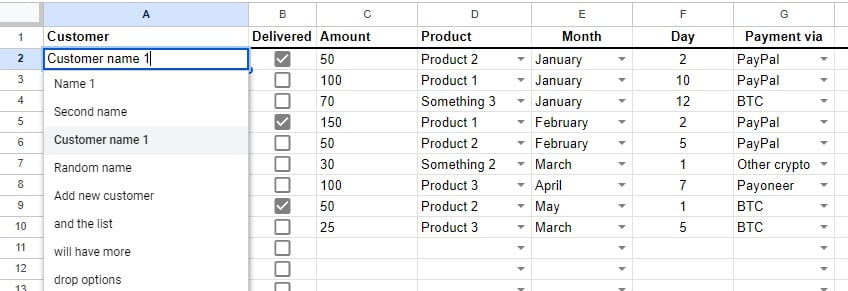
This is a Google Sheet template designed to track sales of your products or services and can be conveniently modified to suit any other sales format besides the typical one it was initially designed for.
By using dropdown menus, you have the ability to integrate and automate calculations for a wide range of items, similar to this example:

The result will not only be visible in the table but also showcased through four charts similar to these:

Who can benefit from this spreadsheet?
Anyone who makes sales but doesn’t use CRM can benefit from this spreadsheet.
Tracking sales is crucial for several reasons, such as understanding your loyal customers and managing relationships better, monitoring monthly sales and growth, and identifying the most popular products, and the most popular payment processor. It doesn’t matter if you sell products or services; you can easily customize the list to suit your business needs.
How many customers can this sheet handle?
There is no specific limit, but if you have hundreds or thousands of customers, you should switch to CRM software instead of a spreadsheet. The original design can accommodate up to 60 customers and 60 products, but you can add more fields as needed.
How do I customize the list?
All the data for the lists is divided into 4 sheets, edit or add products/customers to customize the lists. For example, you can change “Customer name” in the Customer sheet to an actual customer name.
Link to the spreadsheet:
By clicking on this link: Copy Google Sheet Template, a copy of the spreadsheet will be created in your Google Drive and you can start using it.
How do I use it?
To use the spreadsheet, copy it to your Google Drive or download it as an Excel file. Once you make a sale, add it to the list and tick the checkbox once you’ve delivered it. This spreadsheet is designed for a single calendar year, and you can duplicate the current Spreadsheet for the next year while keeping the previous data.
Glossary:
- Customer: an individual or organization that paid for your product or service.
- Delivered: a checkbox to indicate if you’ve delivered the product or service.
- Amount: the price the customer paid for the product or service.
- Product: a dropdown list of your products or services.
- Month: a dropdown menu for the month of the sale.
- Day: the day of the sale.
- Payment via: the payment processor used by the customer.
- Total per product: the sum of all sales per product displayed in a pie chart.
- Total per month: the sum of all sales per month displayed in a chart.
- Payment processors: a chart showing the actual amount of money received after transaction fees are subtracted.
- Total per customer: a chart showing the customer’s total spending.
- Orders per customer: a chart showing the total number of orders per customer.
